

Scenario Analysis: Best Case, Worst Case, Base Case
Why Traditional Probability Trees Destroy Returns and How Elite Investors Think About Uncertainty
The Fatal Flaw in Conventional Scenario Planning
Most investors approach scenario analysis backward. They construct three neat probability-weighted outcomes, assign percentages that sum to 100%, calculate an expected value, and believe they’ve practiced prudent risk management. This methodology, taught in every MBA program and practiced at most institutions, contains a dangerous assumption: that future outcomes cluster around a predictable mean with manageable variance.
After three decades managing concentrated portfolios through six market cycles, I’ve observed something Wall Street refuses to acknowledge: the scenarios that matter most are the ones you assign zero probability to. The 2008 financial crisis, COVID-19’s market impact, and the 2022 inflation resurgence weren’t base case, best case, or worst case—they existed outside the scenario framework entirely. Traditional scenario analysis fails because it normalizes the future into a bell curve when reality follows a power law distribution.
The sophisticated approach isn’t building better scenarios; it’s understanding which business characteristics create asymmetric payoff structures where best cases deliver exponential returns while worst cases inflict linear losses. This distinction separates generational wealth creators from index huggers.
Youtube Link:
The Barbell Framework: How to Structure Scenarios That Actually Work
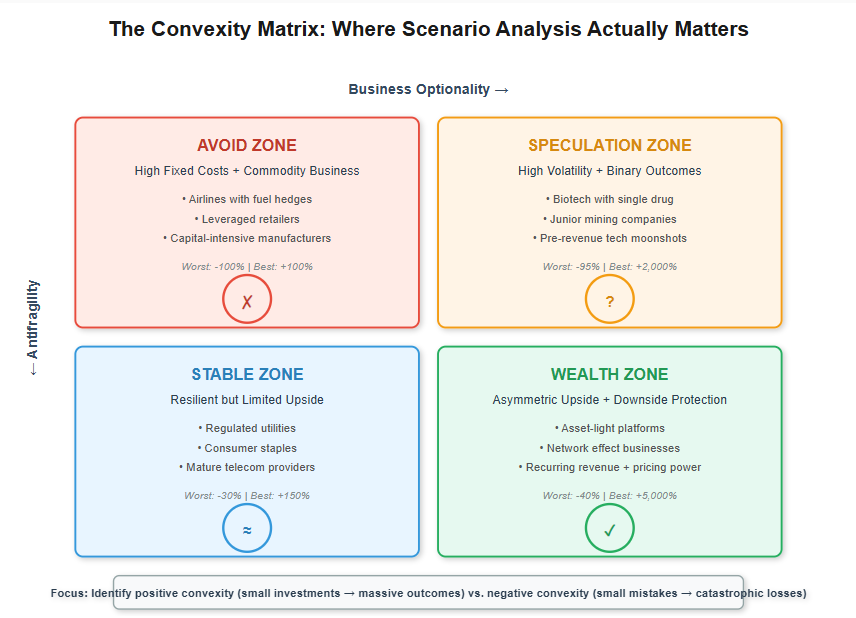
Elite investors don’t think in three scenarios—they think in two dimensions: fragility versus antifragility and optionality versus obligation. This creates a 2x2 matrix that reveals what traditional analysis obscures.
Consider two businesses, both trading at identical valuations with similar growth rates. Company A is a capital-intensive manufacturer with high fixed costs, substantial debt, and commoditized products. Company B is an asset-light software platform with negative working capital, minimal debt, and network effects. Traditional scenario analysis might assign both companies similar expected values because base case projections look comparable.
The critical difference emerges in tail scenarios. Company A’s worst case involves bankruptcy (100% loss), while its best case might be a 3x return constrained by competitive dynamics and capital requirements. Company B’s worst case is a slow decline to perhaps 50% of current value (retained customer base provides a floor), while its best case could be 50x if network effects compound. These aren’t symmetric distributions—they’re fundamentally different payoff structures.
The proprietary insight: scenario analysis should identify negative convexity (where small changes in assumptions create massive outcome swings) and determine which side of convexity you’re positioned on. Businesses with high operating leverage, commodity exposure, or binary regulatory outcomes exhibit negative convexity—small deteriorations cascade into disasters. Businesses with embedded real options, scalable platforms, or anti-fragile revenue models exhibit positive convexity—even modest success triggers self-reinforcing growth.
The Case Study They Don’t Teach: Costco vs. Sears (1995-2015)
In 1995, reasonable analysts constructed scenarios for both Costco and Sears. Sears had brand recognition, real estate assets, and established market position. Costco operated a membership warehouse model with razor-thin margins. Traditional scenario analysis suggested comparable risk-reward profiles.
The missed insight: Sears had negative convexity (high fixed costs, inventory risk, mall anchor obligations, pension liabilities) while Costco had positive convexity (membership model created guaranteed revenue, negative working capital generated float, minimal inventory obsolescence risk). When e-commerce disrupted retail, Sears’s worst case materialized (bankruptcy), while Costco’s membership moat strengthened (best case trajectory). This wasn’t poor forecasting—it was misunderstanding payoff asymmetry.
The counterintuitive pattern: businesses trading at premiums often have superior scenario structures because the market correctly prices downside protection. Sears traded cheaply relative to book value because its asset base created obligations, not options. Costco commanded higher multiples because its business model converted uncertainty into opportunity.
Implementation Protocol: The Five-Question Convexity Screen
Before constructing scenarios, answer these diagnostic questions that separate institutional-grade analysis from amateur probability trees:
1. Fixed Cost Ratio: Do fixed costs exceed 60% of total costs? High operating leverage amplifies both gains and losses, but in practice, downside volatility tends to arrive first and faster. Companies with variable cost structures maintain flexibility across scenarios.
2. Revenue Concentration: Do the top three customers represent over 40% of revenue? Customer concentration creates negative convexity—losing one relationship can trigger covenant violations, force restructuring, or destroy equity value entirely. Diversified revenue streams provide natural hedging.
3. Capital Intensity: Does maintaining competitive position require continuous capex exceeding 6% of revenue? Capital-intensive businesses face perpetual reinvestment obligations, limiting free cash flow and reducing scenario flexibility. Asset-light models convert market growth into shareholder returns.
4. Switching Costs: Would customers lose more than 20% of realized value by switching providers? Embedded switching costs create asymmetric retention—modest service improvements retain customers while competitors must overcome significant hurdles. This dynamic favors incumbents in adverse scenarios.
5. Operating Leverage Direction: Does incremental revenue drop 60%+ to operating profit? Positive operating leverage is desirable only if revenue proves durable. Combine high operating leverage with cyclical revenue, and you’ve constructed a bankruptcy machine. Sustainable operating leverage requires recurring revenue foundations.
These metrics don’t predict specific scenarios—they reveal whether your investment possesses the structural characteristics to benefit from uncertainty or suffer from it. The sophisticated investor doesn’t forecast the future with greater accuracy; they position in businesses where being precisely wrong still generates acceptable outcomes.
The actionable distinction: Stop asking “What are the three scenarios?” and start asking “Does this business get stronger or weaker when surprised?” Companies that improve their competitive position during uncertainty—through market share gains, talent acquisition, or technology adoption—exhibit the antifragility that transforms scenario analysis from fortune-telling into strategic positioning. That’s where generational wealth hides.