

Cintas Explained | Uniform Services, Facility Solutions & Safety Products
The Geographic Monopoly Compounding Effect: Why Cintas Corporation Represents the Ultimate Invisible Moat
The Paradigm Most Investors Miss
When Warren Buffett speaks of economic moats, analysts immediately think of brand power, network effects, or switching costs. Yet the most powerful moat in modern capitalism hides in plain sight: geographic route density. Cintas Corporation (CTAS) exemplifies what I call the “Geographic Monopoly Compounding Effect”—a self-reinforcing advantage where each incremental customer makes the entire operation exponentially more profitable, not linearly.
Wall Street views Cintas as a boring uniform rental company. This perception blindness creates alpha. The company doesn’t just deliver uniforms; it operates a mathematical miracle that violates conventional marginal economics.
YouTube Link:-
The Hidden Mathematics of Route Density
Traditional businesses face declining marginal returns: the 100th customer generates less incremental profit than the 10th. Route-based businesses like Cintas invert this principle entirely.
Consider the economics: A service route has fixed time and fuel costs. When Cintas acquires a new customer along an existing route, they add revenue with near-zero marginal costs. But here’s the counterintuitive insight most miss—this new customer doesn’t just add profits; it revalues every existing customer on that route.
The Route Density Formula:
Profit per Route = (Number of Stops × Average Revenue) - (Fixed Route Costs + Variable Costs)
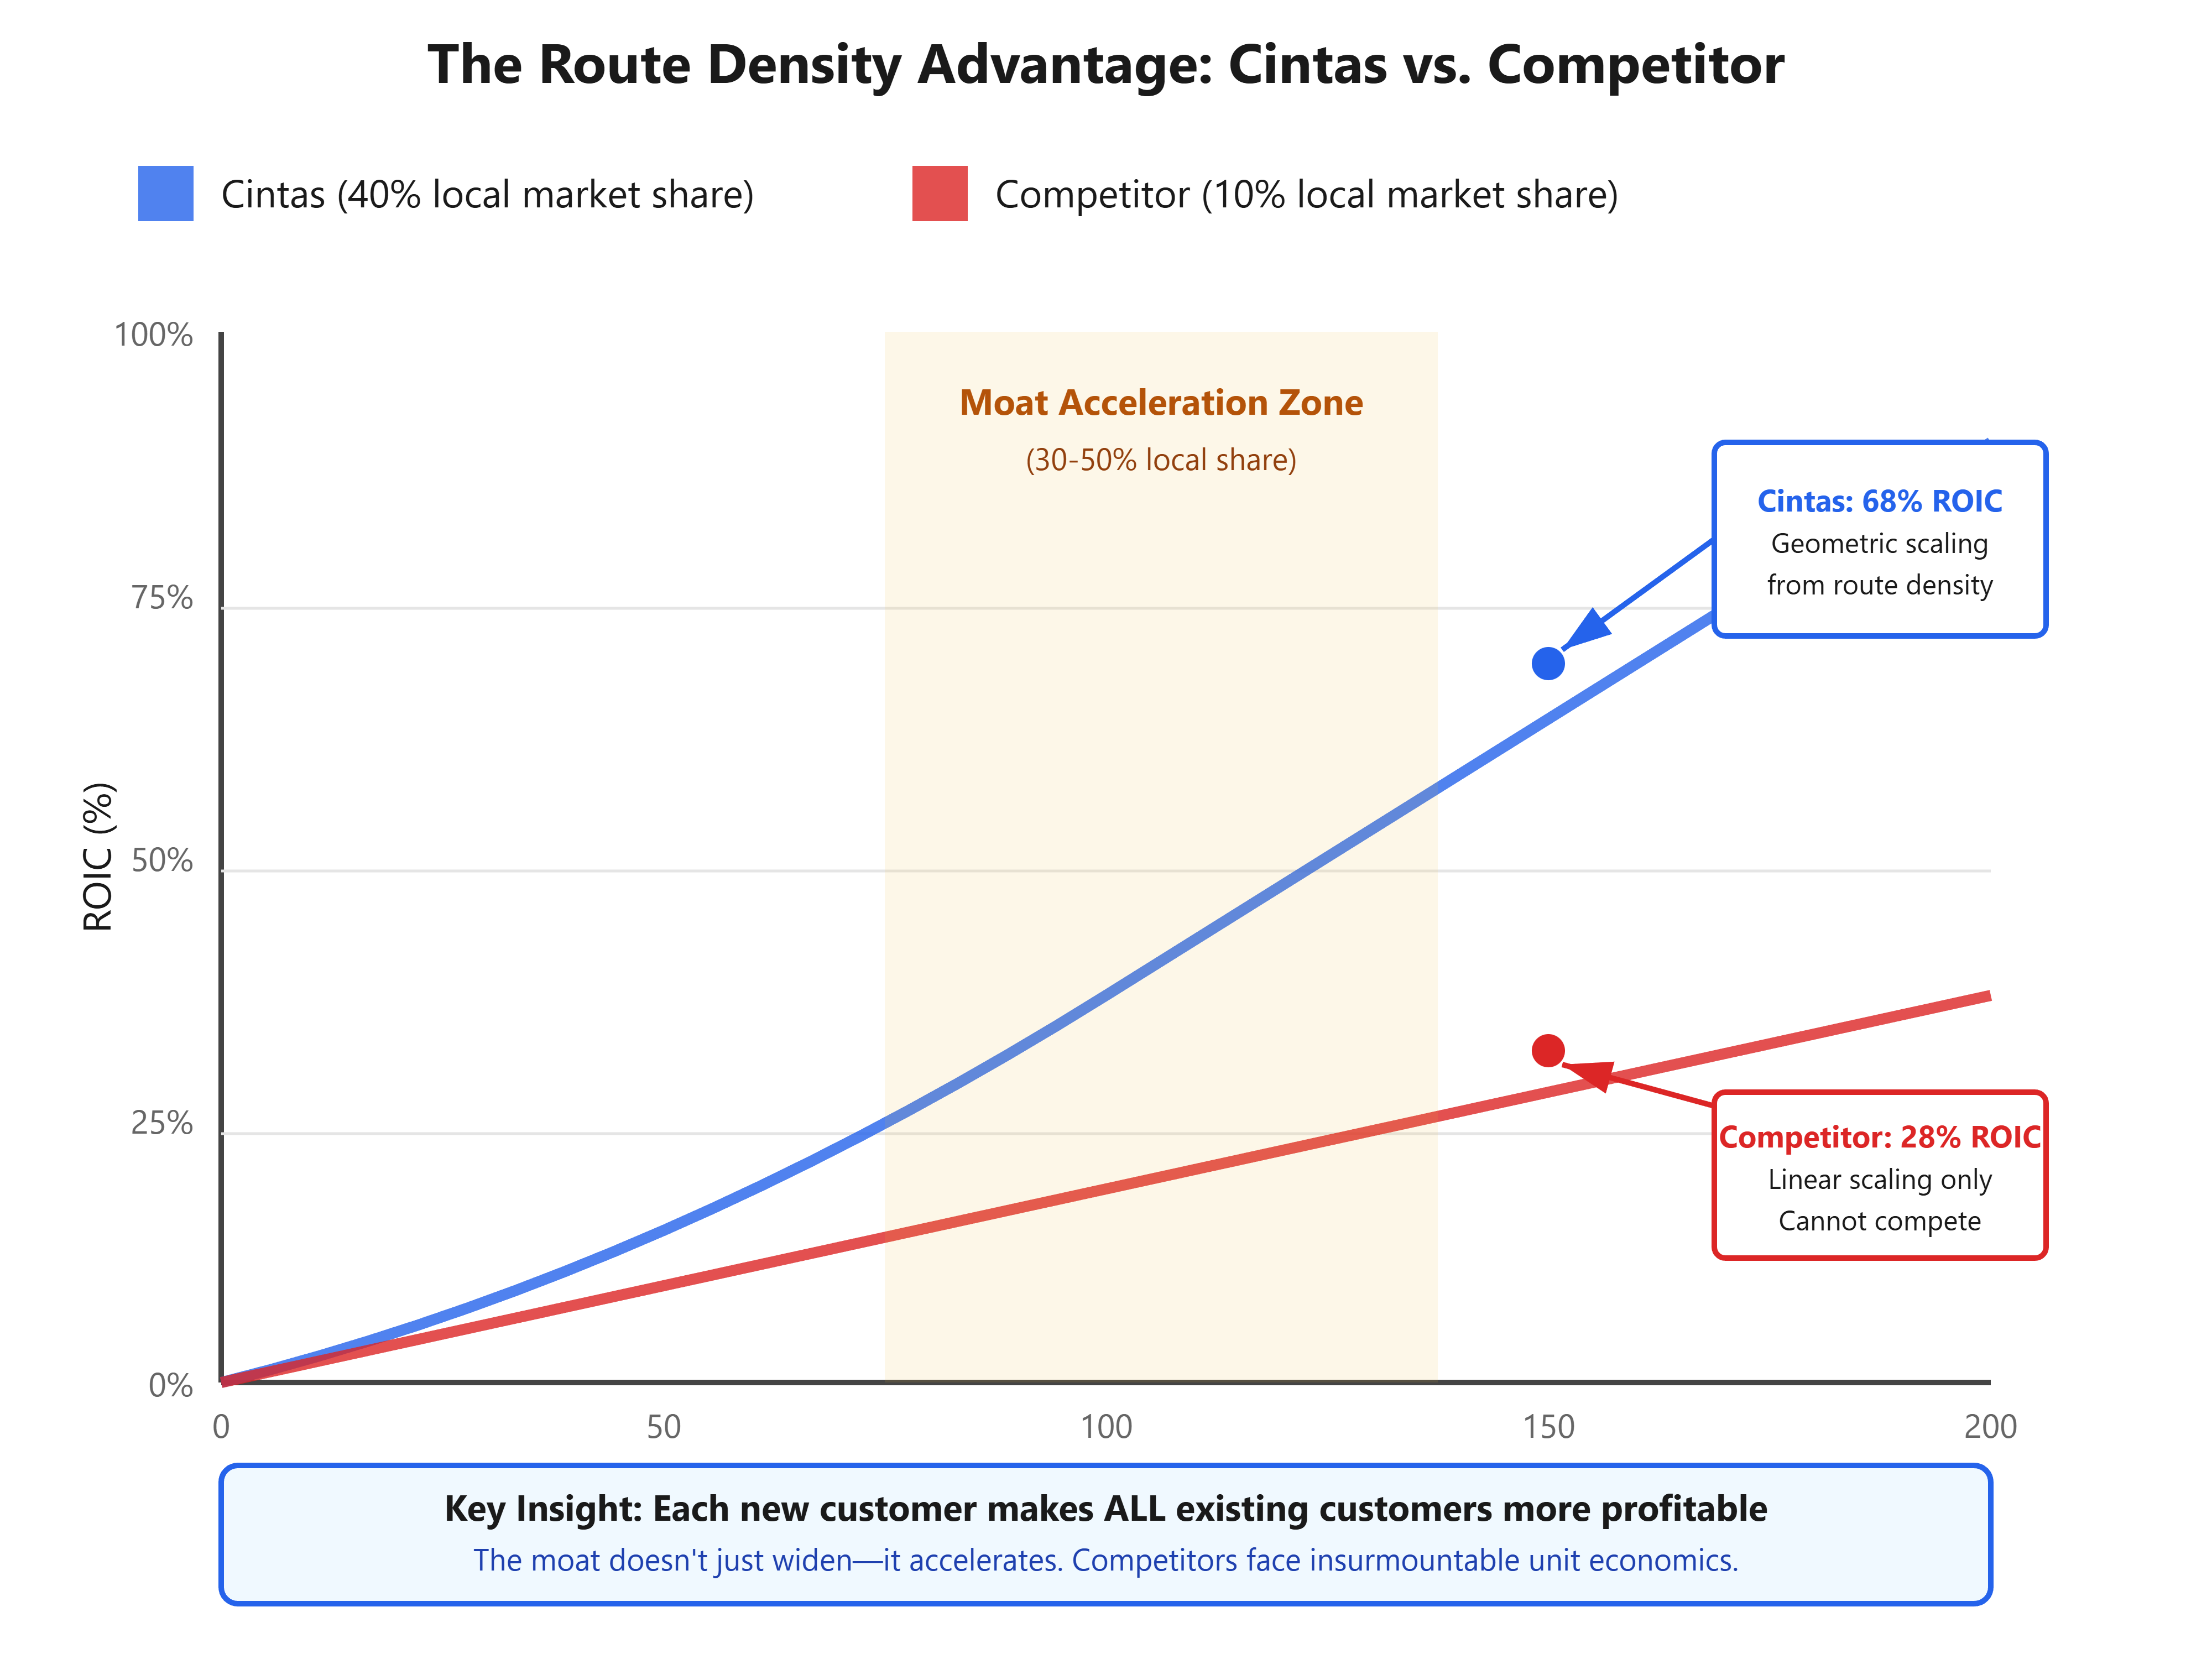
As stops increase, fixed costs get amortized across more customers, but variable costs grow sublinearly due to optimal sequencing algorithms. The result? Return on Invested Capital (ROIC) accelerates geometrically as market share increases in each microgeography.
This creates an unassailable first-mover advantage. A competitor attempting to enter a Cintas-dominated market must either:
Price 30-40% below Cintas (unprofitable)
Service customers scattered across the geography (operationally inefficient)
Achieve equivalent route density (requires years and substantial capital)
The proprietary screening criteria: Look for service businesses where:
Service frequency is high (weekly/daily visits)
Unit economics improve with local market share above 30%
Customer switching requires operational disruption, not just contract termination
The business operates on scheduled routes, not on-demand requests
Visualizing the Compounding Effect
Geographic Monopoly Compounding Effect
The Evidence Most Overlook
Between 2010 and 2024, Cintas achieved a 15-year average ROIC of 23%, more than double the S&P 500’s average. Yet the company’s stock consistently traded at valuations below “exciting” tech companies with far weaker economics.
The critical observation: Cintas’s operating margin expanded from 13.2% to 20.4% during this period despite minimal pricing power in individual contracts. This defies standard economic theory—unless you understand route density mathematics. Each percentage point of local market share gained added disproportionate profitability.
Compare this to traditional industrial companies like Fastenal or Grainger, which serve similar customers but lack route-based economics. Their ROIC remained range-bound between 15-18% over the same period. The difference? Geographic clustering creates compound interest on invested capital.
The overlooked indicator: Monitor Cintas’s revenue per route and average stops per route in their investor presentations. When stops per route increase faster than revenue per route, the company is achieving density in existing markets—a leading indicator of ROIC expansion 12-18 months forward.
Identifying the Next Cintas
The Geographic Monopoly Compounding Effect appears across industries most investors dismiss as “boring.” I’ve identified this pattern in waste management (WM, RSG), industrial gas distribution (APD regional operations), and beverage distribution networks.
The proprietary screening framework:
Service Frequency Test: Customers require service at least monthly. Annual services don’t create route density advantages.
The 30% Inflection Point: Companies crossing 30% share in local markets typically see ROIC inflect upward within 24 months. This threshold represents the point where route optimization algorithms achieve critical mass.
Switching Cost Validation: Calculate the customer’s operational disruption cost of switching. For Cintas, replacing uniforms, retraining staff, and updating inventory systems costs $15,000-$30,000 for a mid-sized customer—far exceeding annual contract value.
Competitive Response Analysis: If incumbents don’t aggressively defend small market share losses, they understand the economics. When Republic Services allows a 2% market share loss in a city, they’re acknowledging that defending would be unprofitable.
Implementation Strategy
For immediate application:
Build a Route Density Scorecard: For any service business you analyze, calculate customers per square mile in their top 10 markets. Companies with >40% higher density than competitors trade at unwarranted discounts to their true moat strength.
Monitor M&A Patterns: When Cintas acquires competitors, they’re not buying revenue—they’re buying route density. Acquisitions in existing markets generate 3-5x higher returns than geographic expansions. Track where they acquire, not just how much they pay.
The Contrarian Entry Point: These businesses underperform during economic expansions (boring) and outperform during contractions (defensive + market share gains from failing competitors). Accumulate positions when growth investors flee to higher-beta opportunities.
The ultimate insight: The power of geographic monopoly compounding means that in 20 years, Cintas’s competitive position will be stronger than today, not weaker—a rarity in capitalism. They compound economic advantages, not just capital.
The market prices Cintas for steady 7-9% annual growth. The route density mathematics suggest 12-15% annual earnings growth is sustainable for another decade as they optimize existing markets. This valuation arbitrage—between perceived “mature industrial” and actual “compounding monopolist”—represents the exact type of misprice that creates generational wealth.
In the next article, we’ll explore “The Regulatory Moat Paradox”—how to identify companies where regulations designed to limit monopolies actually create impenetrable competitive advantages.